Right to Repair Gains Traction as John Deere Faces Trial

On June 11, after decades of prohibiting farmers from repairing their own equipment, a federal court denied John Deere’s motion to throw out the Federal Trade Commission’s right-to-repair antitrust lawsuit against the company. The FTC’s lawsuit argues that Deere, the world’s largest manufacturer of agricultural machinery, violated antitrust laws by denying farmers and independent repair shops access to the diagnostic tools need to repair tractors and combines, forcing farmers to instead rely on Deere’s network of authorized dealers for needed repairs.
The FTC alleges Deere’s monopoly has led to multi-billion-dollar profits for the company while burdening farmers with extortionate repair costs—costs that farmers must bear as their livelihoods rely on the functionality of their equipment.
“If you’re harvesting 1,200 acres, you need your equipment to work on the day that it needs to be working,” says Nathan Proctor, the senior director of the Right to Repair campaign of the U.S. Public Interest Research Group (PIRG). “If you do not have working equipment in the tight window when you need it, you could lose everything—your income, your whole operation, your business.” A 2023 report published by PIRG estimated that each year farmers lose $3 billion to tractor downtime and pay $1.2 billion in excess repair costs because they need to rely on authorized dealerships for repairs.
The impact of slow repair times and equipment malfunctions is amplified given farming’s at times fast pace and the disparate geography of repair shops.
“It used to be that if you lived in a farming community, there would be a dealer within 100 miles,” says Aaron Perzanowski, a law professor at the University of Michigan whose research focuses on right to repair issues. “But because of the increasing geographic concentration of Deere dealers, there are now communities where dealers are 300-400 miles away.”
Transporting equipment for repairs is costly and time-consuming, making it all-the-more a choppy, protracted process.
Deere and other manufacturers are not just restricting access to original parts—they’re actively blocking third-party parts from being used in repairs—restricting the freedom to choose where and how farmers can repair their products, forcing them into costly manufacturer-controlled repair systems. For example, John Deere tractors can be put into “limp mode,” limiting functionality until the issue is cleared by dealer-only software, meaning farmers can’t make simple repairs without going through the manufacturer.
In January, under former chair Lina Khan, the FTC, along with the Illinois and Minnesota Attorneys General, filed a lawsuit against Deere in the last days of the Biden administration. In 2022, the Biden administration launched an investigation into Deere’s abusive practices after the National Farmers Union, Farm Action and state-level farmers unions filed a complaint with the FTC. Michigan, Wisconsin and Arizona have since joined the lawsuit.
“We applaud this court ruling, which ensures that the Federal Trade Commission can go forward with holding John Deere accountable for robbing farmers of their time and money,” says Joe Maxwell, co-founder of Farm Action, a nonpartisan agricultural watchdog organization led by farmers. “About half of America’s farmers are kept under the thumb and control of John Deere, and FTC’s action is a critical step to check that power.”
Farm Action has been a leading voice in this fight for years. In 2022, Farm Action and other advocacy groups petitioned the FTC to investigate Deere, leading to the FTC’s lawsuit.

In 2023, Trump-appointed Judge Iain D. Johnston of the U.S. District Court for the District of Northern Illinois ruled that John Deere must face similar claims from farmers who filed a class action lawsuit in 2022, which is still active despite vigorous objections from Deere (Deere & Company is headquartered in Illinois). Deere has denied nearly every allegation in the FTC’s lawsuit and moved dismiss the suit, claiming that it does not compete in the market for repair services, that the statute of limitations had run out on the states’ claims and that the states lacked standing. Deere, moreover, challenged the FTC’s constitutional authority as an independent, bipartisan board that enforces antitrust laws, arguing that restrictions on the removal of FTC commissioners illegally keeps the president from exercising oversight.
Johnston, who is also the judge in the federal lawsuit against Deere, rebutted each of Deere’s claims in his June 11 judgement denying Deere’s motion, saying that Deere failed to show how it was harmed by the FTC’s procedures for removing commissioners.
“Sequels so rarely beat their originals that even the acclaimed Steve Martin couldn’t do it on three tries,” Johnston wrote, in reference Deere’s 2023 motion to dismiss the class action lawsuit. He continued:
See Cheaper by the Dozen II, Pink Panther II, Father of the Bride II. Rebooting its earlier production, Deere sought to defy the odds. To be sure, like nearly all sequels, Deere edited the dialogue and cast some new characters, giving cameos to veteran stars like Humphrey’s Executor. But ultimately the plot felt predictable, the script derivative. Deere I received a thumbs-down and Deere II fares no better.
Deere did not respond to Barn Raiser’s request for comment.
In January 2023, a year after farmers filed their class action lawsuit, Deere released a statement claiming that it supports customers’ right to repair equipment, along with a memorandum of understanding (MOU) signed with the American Farm Bureau Federation (AFBF). The MOU stated that Deere would make its software, tools and documentation available so that farmers and independent shops would be able to make their own repairs. In exchange, the AFBF agreed not to support right to repair legislation.
While this may sound good, there is nothing binding about this statement.
“I disagree that the MOU is an effective mechanism. There’s no real enforcement of power. There are significant loopholes in the language that they signed. I also don’t think that they’re abiding by the language, and the Farm Bureau (AFBF) really doesn’t have a way to make them,” says Proctor.
The actual language used in the FTC’s lawsuit claims that Deere has a monopoly over the market. The ambiguity comes into play when it comes to how the “market” is defined—which Perzanowski says is always a contested question in monopolization cases.
“There’s some question as to whether or not the right way to define the market is looking only at restricted repair services,” says Perzanowski. “You could instead take a broader view and ask, what’s John Deere’s level of market power when it comes to repair services for their equipment in general?”
Willie Cade, board member of The Repair Association, says that the FTC’s filing importantly makes the claim that Deere’s monopolization of repair in fact affects all repairs. “It’s not a monopolization of every repair, but it affects the price of every repair, which is remarkable,” says Cade.
One significant factor is the highly computerized and technical nature of today’s tractors. According to Farm Action, a single combine nowadays can have 125 software-connected sensors, which are each connected to a controller network. Repairs can be understood in two categories: the ones that the mom-and-pop shop can still do or that you can still rely on self-repair for, and another subset that requires Deere’s own “Service ADVISOR” software, a specialized program made available only to authorized dealers that is often the only way to fully diagnose and repair Deere’s own equipment.
“Farmers have no alternatives because of the system created by Deere, which charges supracompetitive prices because of the lack of any alternatives,” wrote Johnston in his judgement. “In technologizing its equipment, Deere makes farmers reliant on Deere’s own ADVISOR software. And, in only licensing that software to its Authorized Dealers, Deere forces farmers to visit those shops instead of using closer, cheaper options.”
According to Perzanowski, the Michigan law professor, the FTC has found that nobody, apparently even John Deere, knows which parts actually require this program. “And so that makes it really hard to decide or to figure out what percentage of the overall repair market is made up of these restricted repairs,” he says. “It seems at least plausible to me that the reason John Deere can’t answer that question is precisely because they anticipated this lawsuit. It’s really helpful if you can just say, ‘We don’t know. We’ve never bothered to actually go through and make a list of these repairs.’ ”
And why might Deere’s interests seem to contradict those of the farmers who buy their equipment? Proctor at U.S. PIRG says that the demands in highly concentrated markets to increase revenue without the ability to increase sales (as these markets are limited), can lead to outcomes that violate competition laws.
Seemingly paradoxically though, a looser grip on the repair market could produce greater profits for Deere, while simultaneously creating more accessible repairs for farmers.
“Due to the lack of rights to repair their own farm equipment, farmers stand to lose $4.2 billion a year. About 20% of that is realized in higher prices for repair and services,” says Cade. “The rest is in lost yield. So imagine if farmers could get that rough number, that $3.8 billion back or even $3.7 billion back? If they could get that as profit, of course John Deere is going to do better with sales.”
There is broad bipartisan support for right to repair issues among the general public. A 2020 poll shows that 73% of Republicans, 81% of Democrats and 73% of Independents support right to repair legislation, which aims at giving individuals and independent repair shops the legal right to access service information, replacement parts and software tools to fix a broad range of equipment, from smartphones to cars to medical devices.
“The politics are very much on the margins of the whole thing,” says Proctor.
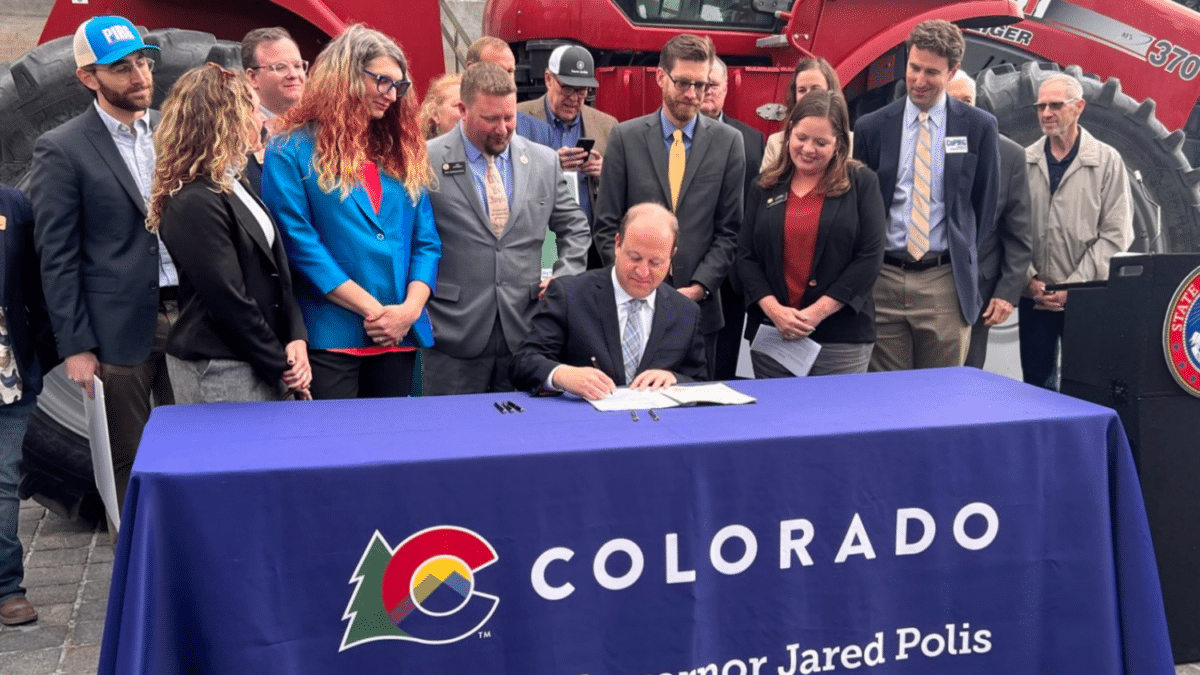
At least 40 states have introduced some form of right to repair legislation, and at least seven (California, Colorado, Connecticut, Minnesota, Maryland and New York) have passed right to repair laws.
For now, the Trump administration’s FTC appears willing to continue to pursue the lawsuit. The newly appointed FTC Commissioner Andrew Ferguson, who sat as a Republican commissioner during the Biden administration, released a dissenting opinion upon the FTC’s decision to move forward with the case. He wrote that he was dissenting on “procedural grounds,” attacking the FTC’s outgoing Democratic majority for the lawsuit’s timing—brought forth in the midst of administration changes. Yet, he acknowledged that “the right to repair one’s own equipment matters a great deal,” and wrote, “if the commission and Deere cannot reach such a settlement, then the courts will resolve the right to repair question here. Securing real relief for farmers in short order should be the commission’s focus.”
Cade at the Repair Association noted the unusual rift between pro-business factions of MAGA and conservative trade groups—two demographics that often share political interests.
“It’ll be really interesting to see in the coming time frame, if this administration is actually going to step up for farmers, or for corporations?” Cade says. “Because J.D. Vance, Josh Hawley, these guys are real anti-monopolists. And I, as a very liberal Democrat, can’t stand either of them. But as a right to repair advocate, both of them are on my side.”
For Cade, a lifelong advocate for farmers and repair rights, this presents an opportunity. He is enthusiastic about the prospect of these more homogenized political factions to splinter off into more nuanced interest groups as this issue evolves. There is already clearly a major disconnect between the national leadership and trade members.
“There are two basic trade organizations that are in on this [lawsuit],” said Cade. “One is the American Farm Bureau Federation, and they signed an MOU with John Deere. They’re always saying, ‘Don’t pick on our manufacturers,’ ‘We love our manufacturers’ … But I went down to the AFBF conference, and every person that I talked to except two people who were on staff were like, ‘Oh, yeah. This is a really important issue for us.’ ”
According to Perzanowski, this case will at best require a couple of years before it gets to the first round of appeals.
In the meantime, right to repair advocates will continue to make noise. Whether policymakers and courts side with them—or with corporate giants like Deere—we’ll have to wait and see.
The post Right to Repair Gains Traction as John Deere Faces Trial appeared first on Barn Raiser.


 The U.S. Department of Agriculture announced late Tuesday it will release previously authorized grant funds to farmers and small rural business owners to build renewable energy projects—but only if they rewrite applications to comply with President Donald Trump’s energy priorities.