Native Americans Resist SCOTUS Voting Rights Decision

Over a century after the 1924 Indian Citizenship Act officially recognized Native American people born in the United States as citizens, voting rights advocates and Native communities are now grappling with a significant blow to their right to vote ahead of the 2026 midterm elections.
On April 29, the U.S. Supreme Court sided with self-described “non-African American” voters who argued that a congressional district map drafted by Louisiana lawmakers after the 2020 census violated the Voting Rights Act. In their lawsuit, Louisiana v. Callais, the voters objected to the creation of a second Black-majority district, out of six congressional districts in the state, where Black Louisianans make up one-third of the population. They claimed the action discriminated based on race, and six of the court’s nine justices agreed.
The ink was barely dry on the Callais opinion when states, including Wyoming, Montana, Florida, Alabama, Tennessee, Mississippi, Georgia and South Carolina, began altering, or figuring out how to alter, their election districts to eliminate those dominated by voters of color and to favor Republicans in races for local, state and national offices.
This redistricting will exacerbate the existing barriers to Native election access says Judith LeBlanc, a citizen of the Caddo Nation and executive director of Native Organizers Alliance, which helps grassroots Indigenous groups build their organizations. “We have been facing challenges and obstacles to vote ever since we got the right to vote,” LeBlanc says. The Callais-driven redistricting “has one purpose—to deny us the right to elect someone who has the same life experiences we do,” she says. She calls it “gerrymandering driven by a political agenda.”
In her dissent, Justice Elena Kagan wrote that Section 2 of the Voting Rights Act of 1965, which guarantees that nothing shall “deny or abridge the right of any citizen of the United States to vote on account of race or color,” is now “all but a dead letter.” She was joined in her dissent by Justices Sonia Sotomayor and Ketanji Brown Jackson.
In an opinion concurring with that of the majority of justices, Justice Clarence Thomas (joined by Justice Neil Gorsuch) wrote that the Supreme Court should never have interpreted Section 2 in a way that gave racial groups “an entitlement to roughly proportional representation.” He called this a “disastrous misadventure.”
“This point of view is either profoundly mistaken or intentionally cruel,” says Jacqueline De León, of Isleta Pueblo, senior staff attorney for the Native American Rights Fund (NARF).” It denies the reality that minorities in this country are often targeted and stripped of political power.”
Indeed, the opinion has given free rein to that phenomenon. De León points out that much of the redistricting that has followed the decision has been focused on discriminating based on race. “Which is exactly what Section 2 was designed to prevent,” she says. Having unleashed racial discrimination, the Callais decision would then do for Native voters exactly what it set out to accomplish, which is block claims intended protect their rights.
An example of a Section 2 claim is the federal lawsuit three Crow Creek Sioux Tribe members brought in 2003 against Buffalo County, South Dakota. The tribal members alleged voting districts were drawn to discriminate against the county’s majority Native population, violating the Voting Rights Act’s Section 2, as well as the U.S. Constitution’s 14th and 15th amendments, which guarantee the right to vote, the right to equal protection and more.
In elections for County Commission, which is the local governing body, Buffalo County had for decades packed 1,500-plus tribal members into one district, while 100-plus and 300-plus mostly non-Native residents made up each of the other two districts. This allowed the relatively small number of non-Natives to control Buffalo County’s government and resources. After the lawsuit was settled in 2004, the districts were evened up, and county elections were put under federal supervision.
Long-haul voting
The Supreme Court’s gutting of Section 2 of the Voting Rights Act is part of a larger, decades-long struggle on the part of Native Americans to gain equal access to the ballot box. “Indians have faced a prolonged battle to gain the franchise on a footing equal to that of Whites,” write University of Utah Political Science Professor Emeritus Daniel McCool and co-authors in Native Vote: American Indians, the Voting Rights Act, and the Right to Vote (Cambridge University Press, 2007). “Much like the struggle for Black voting rights in the South, this conflict has been long, arduous and often bitter.”
In the rural West, nearly universal impediments for Native voters are the long distances they must travel to register and to vote. Some voters from Montana reservations, for instance, drive as many as 200 miles round trip. In research undertaken for the Justice Department in 2012 for the federal lawsuit Wandering Medicine v. McCulloch, University of Wyoming geography professor Gerald R. Webster examined three Montana reservations. He found that in these areas, whites, on average, lived much closer to courthouse voting precincts than reservation residents. As a result, in each case the latter traveled two to three times farther than whites to get to the precinct to vote. The problem was compounded by limited access to a vehicle and funds for gas.
In early May, a Montana state court recognized this problem when it blocked a 2025 state law that would have cut back Election Day voter-registration hours, which had previously allowed voters to both register and vote on the same day. The law would have eliminated the final eight hours of Election Day voter registration.
In a case brought by NARF, the American Civil Liberties Union and others, the court ruled that the measure likely disproportionately harmed Indigenous voters from rural reservation communities and violated their right to vote. Requiring many of them to make two trips—once to register, then again on Election Day to cast their ballots—was a too heavy a burden, said the court. Because the case was filed in state court, the losers cannot appeal it to the Supreme Court, and it will not be affected by the Callais decision.
As Gene Small, president of the Northern Cheyenne Tribe, in Lame Deer, Montana, which was a plaintiff in the lawsuit, remarked in June 2025: “We are not asking for special treatment—we’re demanding equal treatment.”
For De León, the outcome of the case was both successful and irritating. “It’s incredibly frustrating to see wasted time and resources—used to deny the vote rather than address inequalities in voter access,” she says.
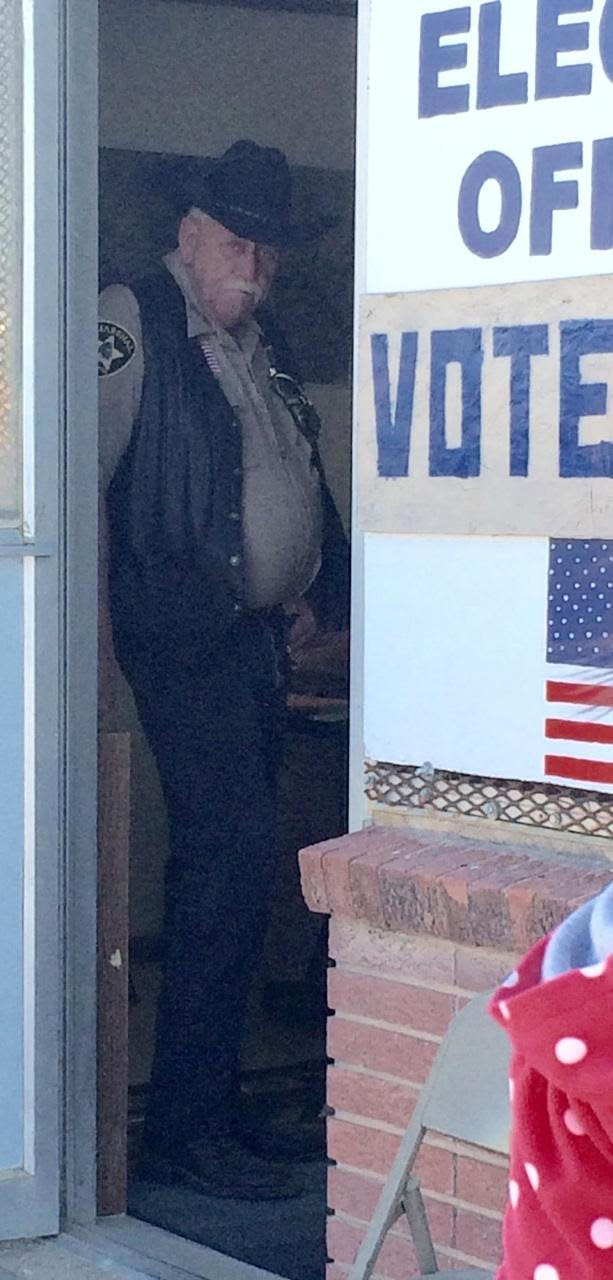
Hurdles for Native voters may be official, like federal and state laws and Supreme Court opinions. Other barriers are spontaneous schemes, cooked up locally. In 2014, after days of high turnout of Native voters during early voting, the mainly white-inhabited South Dakota county running federal elections for Pine Ridge Indian Reservation stationed a sheriff in the doorway of the polling place.
Pot-bellied and mustachioed, with the requisite cowboy hat and boots, he blocked the opening and alarmed the reservation’s Oglala Sioux voters. They worried that getting past him to cast a ballot might inexplicably land them in jail. The Justice Department intervened, telling the county voting officials to remove the sheriff. They did, and turnout rebounded.
A seat at the table
Reduced access to the polls has had enduring consequences for Fort Belknap Indian Community in northeastern Montana, says William Main, the community’s former chairman. When governments—county, state or federal—make decisions that affect those with minimal voting rights, the consequences for any tribe, Fort Belknap among them, are lack of economic development, meager educational offerings, inadequate medical and dental care and more, he says.
Treaty rights that Native people paid for years ago with their lives and their land are being stripped away, according to LeBlanc at the Native Organizers Alliance. This includes the right to health care, she says. “We’ve never had fully funded health care, so we’ve depended on third parties—Medicare, Medicaid and the Affordable Care Act. When the Medicaid cuts hit hard later this year, it’s going to have a devastating effect on our health care systems.”
At Fort Belknap, insufficient federal support for law enforcement is a serious problem, Main says. In 2022, the tribe brought a federal lawsuit challenging the funding level. The suit is ongoing. Other tribes in Montana have said that they too lack appropriate federal financing for law enforcement.
Barn Raiser has reported on even more tribes that struggle to get the federal government’s attention for this critical community-safety issue. In 2023, the Oglala Sioux Tribe sued the Bureau of Indian Affairs for paying for just 30-some officers and seven criminal investigators to patrol the 30,000 tribal members on its 3.1-million-acre Pine Ridge Indian Reservation—an area nearly the size of Connecticut. In 2024, the business committee of the Ute Tribe told Barn Raiser that three officers at most patrol an even larger expanse—its 4.5-million-acre Uintah and Ouray Reservation, in Utah.
Ravaging the land
Disenfranchised Native communities can experience extreme environmental destruction, and they can face severe backlash for making their voices heard.
The 2016 protests at Standing Rock against an oil pipeline planned to cross the Missouri River and jeopardize their water supply drew attention to the many dangerous pipelines and other oil and natural-gas extraction and transport facilities on Native land. Journalists from around the nation and the world reported on the North Dakota police and private contractors they hired, who shot demonstrators with rubber bullets and subjected them to gassing, hosing with cold water in below-freezing temperatures, arrest and other aggressive tactics.
The methods were not new. During the 1960s and 1970s, unarmed members of Northwest tribes were shot at, beaten and arrested while seeking recognition of treaty-guaranteed fishing rights, according to former Puyallup Tribe chairwoman Ramona Bennett. For decades, Nebraska law enforcement roughed up and arrested protesters from Pine Ridge Indian Reservation as they tried to shut down Whiteclay, a tiny bordertown that existed almost exclusively for more than a century to bootleg alcohol onto the dry reservation.
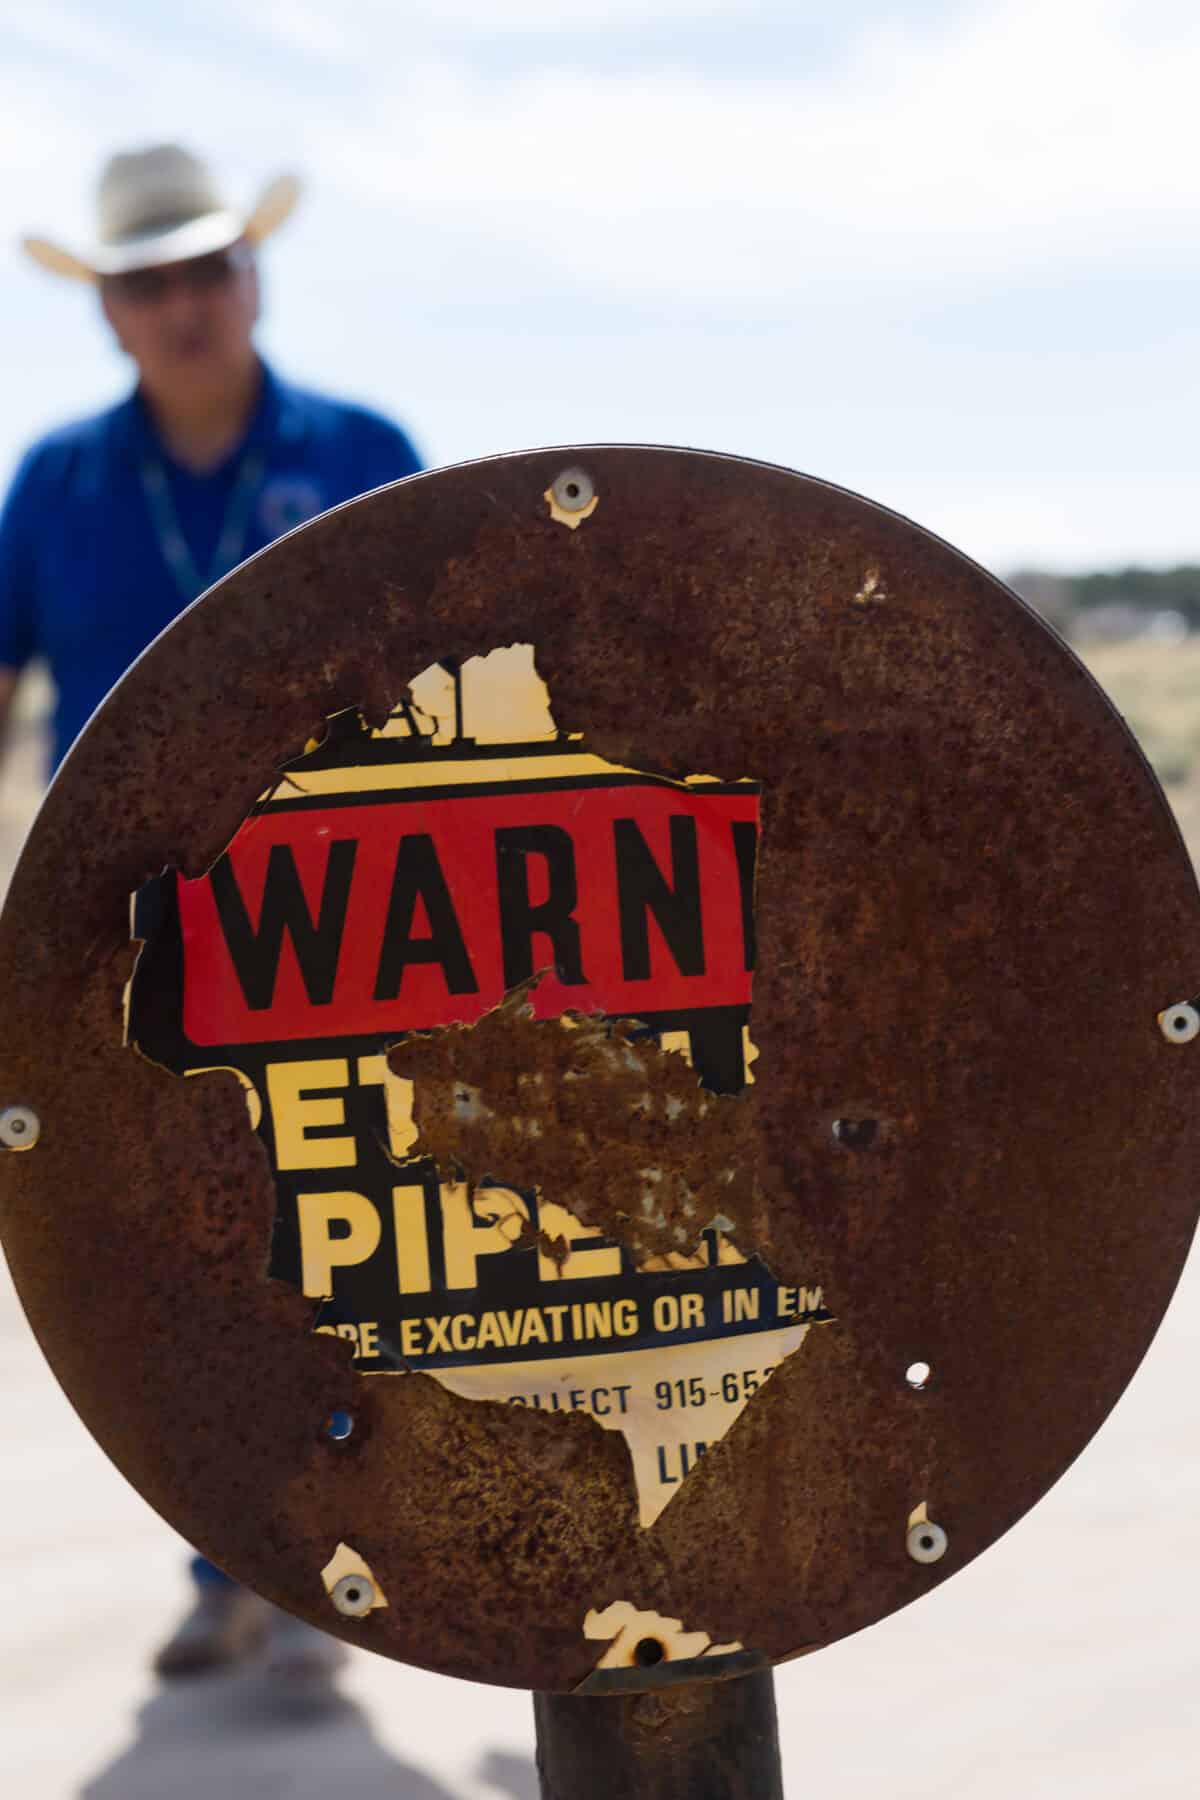
Mining is another scourge. A 2023 paper from the Native American Budget and Policy Institute reports that in the 12 western-most U.S. states, more than 600,000 Native people live within a few miles of 160,000-plus abandoned mines for uranium, vanadium, gold, copper and lead. The mines are typically unmarked and unfenced, says the report. According to a 2017 study in Current Environmental Health Reports, they continually expose tribal members to the dangerous toxins used to extract and refine the ore and will not be cleaned up for generations.
After decades of looking the other way, the Nuclear Regulatory Commission (NRC) traveled to the Navajo Nation in 2022 and took testimony on the country’s largest, almost entirely unknown nuclear accident. The accident at Three-Mile Island, Pennsylvania, recognized worldwide, resulted in a negligible release of radioactivity. Few, other than the Navajos affected, have heard of a far worse incident at Church Rock, New Mexico. In 1979, a dam holding back mining waste broke, releasing more than 95 million gallons of radioactive liquid and 1,000 tons of a sand-like radioactive substance. The dangerous material spewed some 150 miles over the Navajo reservation. Many Navajos were afflicted with cancer and other chronic diseases. On its website, NRC still refers to Three-Mile Island as “the most serious accident in U.S. commercial nuclear power plant operating history.”
Looking forward
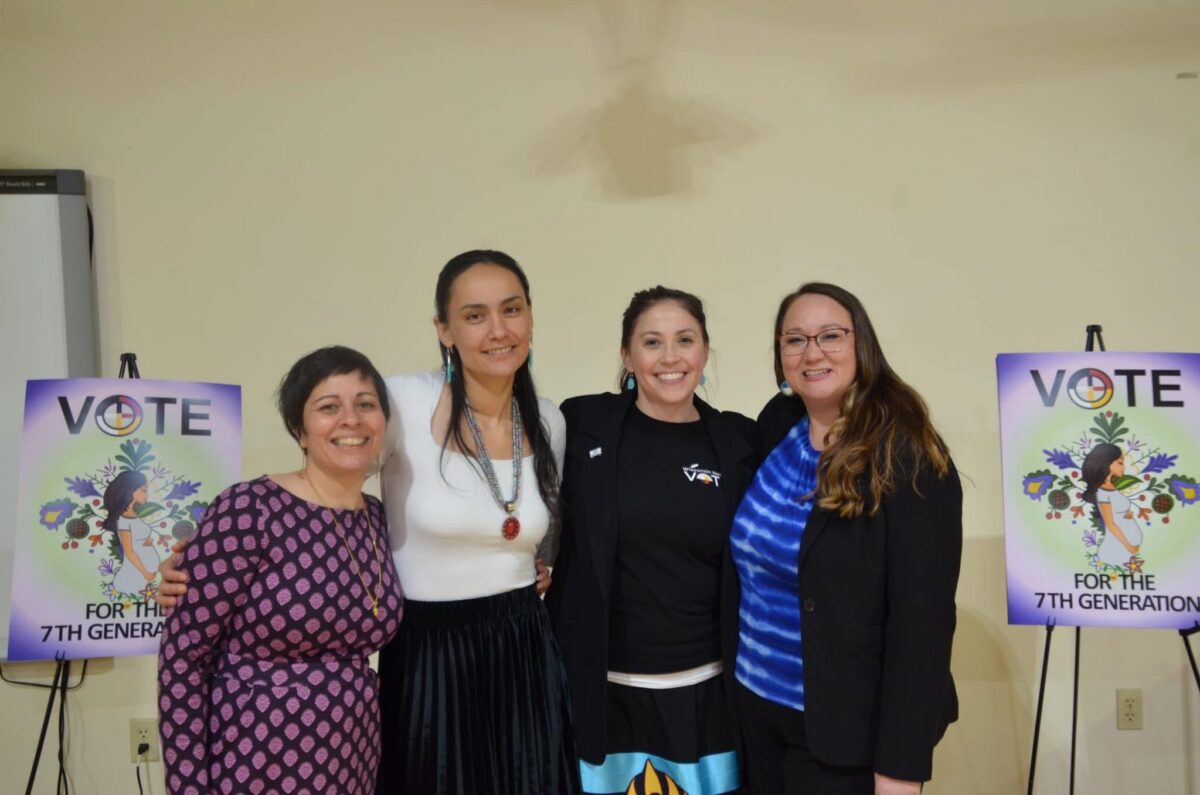
In the face of all these difficulties, numerous Native candidates look likely to be elected or re-elected in upcoming national, state and local races. They include former Secretary of the Interior Deb Haaland, of Laguna Pueblo, running for governor of New Mexico; Minnesota Lt. Governor Peggy Flanagan, White Earth Band of Ojibwe, campaigning to become U.S. senator from that state; Congresswoman Sharice Davids, Ho-Chunk, seeking re-election as U.S. representative from Kansas; and former Congresswoman Mary Peltola, Yup’ik, looking to become U.S. senator from Alaska.
They, and many more Native candidates nationwide, have broad appeal in districts that are not necessarily majority Native. “They’re not like other candidates, who say vote for me, and I’ll accomplish this or that,” LeBlanc says. “Our people’s campaign speeches talk about bringing communities together [and] how important it is to form circles of people who are willing to struggle for everyone’s human rights.”
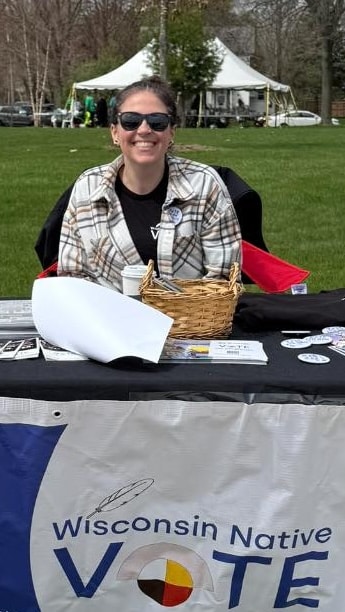
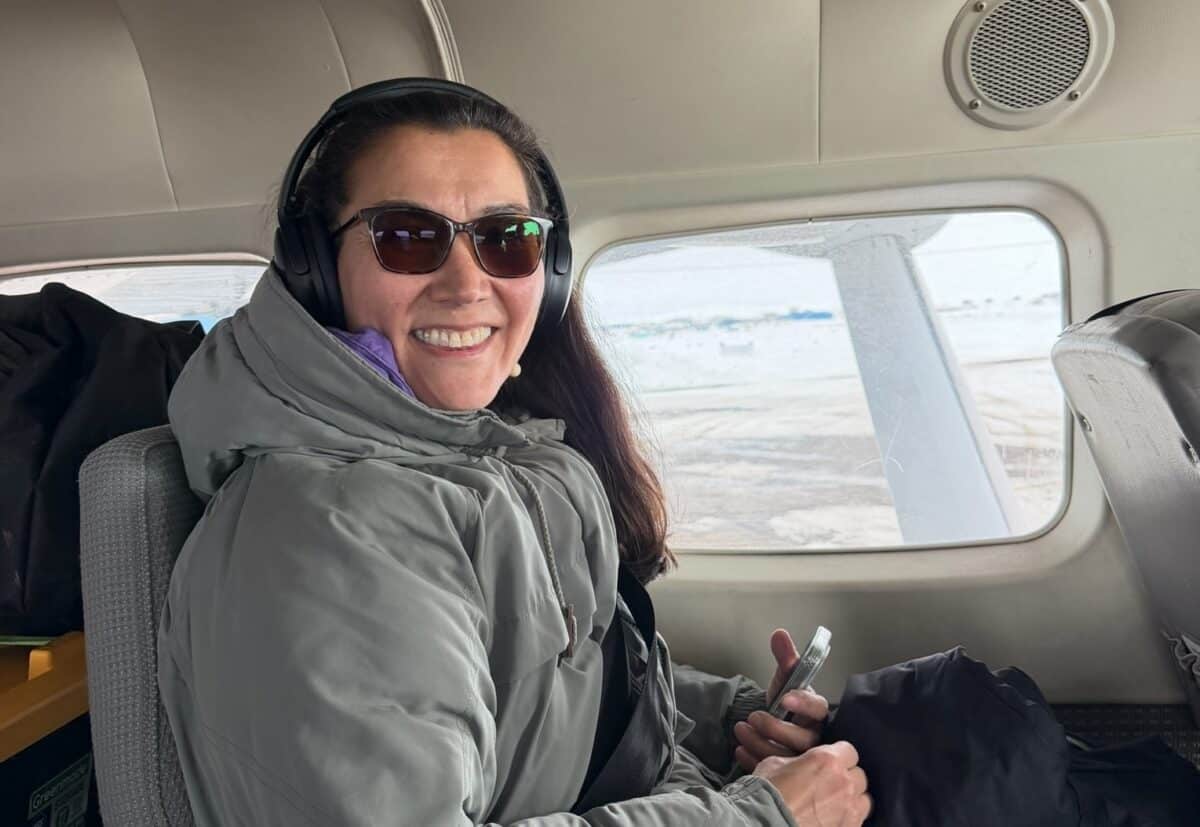
“Indigenous people are taking their place at a table where they’ve always had the right to be,” says Maria L. Haskins, a regional tribal organizer for Wisconsin Native Vote, which is part of the advocacy organization Wisconsin Conservation Voices. Haskins is a Lac Courte Oreilles descendant with Stockbridge-Munsee and Oneida Nation of Wisconsin lineage.
Decades will be required to rebuild the immense destruction of our world and our democracy that has occurred, and is still occurring, according to LeBlanc. But rebuilding will be continual and not simply centered on elections. “We have to think Indian about this problem,” she says. LeBlanc describes 100 years of treaty making, with five generations of Native people leaning into the future. “That’s the position we’re in today, a one-, two- or three-generation effort to create solutions that will be better than what we had.”
Haskins is on the ground in Wisconsin doing just that. “We know our tribal communities are disenfranchised,” she says, “so if we can provide people with accurate information, they will make informed decisions when they’re casting their ballot.” Activities she engages in may include door-to-door canvassing or setting up booths or tables at community events. These range from round dances and powwows to moccasin- and basket-making workshops. She helps tribal members figure out where their precinct is and shows them how to find transportation to it.
“We focus on relationship building,” Haskins says. “Our ancestors have been doing that since the beginning.”
NARF will continue to fight on behalf of Native Americans, De León says. “Callais is a setback, but we will persevere.” She called passage of the John R. Lewis Voting Advancement Act, which includes the Native American Voting Rights Act, essential to the preservation of our democracy.
Says LeBlanc, “We have to create a democracy that we’ve never had before, where sovereignty and the care of Mother Earth and the care of all living beings are at the center of policy making, where we all have equal access and equal rights to live in a good way.”
The post Native Americans Resist SCOTUS Voting Rights Decision appeared first on Barn Raiser.
Annual fishing derby hooks generations of young anglers
‘In every room, every hand would go up’: Panelists discuss cancer, pesticides and environmental risks

Rising cancer rates in Iowa and other farming states are becoming impossible for communities to ignore, experts said on Thursday.
During an Investigate Midwest panel discussion on pesticides and public health, speakers pointed to growing concern over environmental exposures tied to industrial agriculture, including pesticides, nitrate contamination, PFAS and radon.
The virtual event featured oncologist Dr. Richard Deming of the MercyOne Cancer Center in Des Moines, investigative journalist Carey Gillam, Iowa Environmental Council policy director Kerri Johannsen, Food & Water Watch research director Amanda Starbuck and Iowa resident Lisa Lawler, a breast cancer survivor first diagnosed last year.
The panel discussion — sponsored by Second Story Fundraising — is part of Investigate Midwest’s broader reporting project examining pesticide use, cancer rates and health concerns in agriculture communities.
A nationwide analysis found that the 500 counties with the highest pesticide use per square mile are located in the Midwest. Sixty percent of those counties also had cancer rates higher than the national average of 460 cases per 100,000 people, according to an analysis of data from both the U.S. Geological Survey and the National Cancer Institute.

Johannsen said the Iowa Environmental Council in partnership with The Harkin Institute held more than a dozen listening sessions across Iowa last year and repeatedly heard the same stories from residents.
“One (question) we would ask was, ‘Have you or someone close to you had a cancer diagnosis?’ And in every room, every hand would go up, and people would kind of look around at each other and it was just kind of a moment of realization that this was a real problem in their community,” Johannsen said.

Lawler, who grew up on a farm in Hardin County, Iowa, said she was diagnosed with breast cancer in April 2025 after moving back to her hometown years earlier to help care for her parents.
Lawler said she pursued genetic testing after her breast cancer diagnosis because her mother had also developed breast cancer. The testing did not identify common hereditary breast cancer markers, she said, raising concerns about possible environmental factors.
She and other panelists stressed that farmers are not to blame.
“They are people that are hard working … and consider themselves good stewards of the land,” she said. “What are they being told that they need to use on their land? That’s the crux of it.”
Want to see more conversations like this?
Your support helps Investigate Midwest continue reporting on pesticides, public health and the systems shaping rural communities across the Midwest.
Panelists described modern ag as a system shaped by decades of industrialized farming, chemical manufacturers and federal farm policy that has left many farmers heavily reliant on pesticides.

Gillam, author of “Whitewash” and “The Monsanto Papers,” said glyphosate use surged after Monsanto introduced genetically engineered crops designed to survive direct spraying, eventually contributing to resistant weeds and heavier chemical use.
“We sit here today, with our agricultural production, our food production, very much directed by the company selling the seeds and the chemicals, who direct our lawmakers, policymakers, our leaders, and our regulators how to oversee these crops (and) what to say about their safety,” Gillam said.
Deming said Iowa’s second-highest cancer rate in the country likely stems from a combination of factors, but argued the state’s widespread use of agrichemicals and unusually high radon exposure warrant serious attention.

“The reason that we need to look at the environment is there’s a great percentage of our land that is under (agricultural) cultivation utilizing chemicals, and there’s ample evidence that some of these chemicals increase the risk of cancer,” Deming said.
Panelists also discussed ongoing litigation involving pesticide manufacturers, including Bayer, and a pending U.S. Supreme Court decision that could shape whether chemical companies can still be sued for failing to warn consumers about cancer risks tied to their products.
The conversation frequently returned to the tension between modern ag production and public health concerns. Starbuck argued the U.S. has become increasingly dependent on chemical-intensive commodity production, leaving many farmers financially locked into systems where a large share of Midwestern corn is used for ethanol, animal feed and processed food ingredients.
Very little actually feeds people directly, Starbuck said.

“(Farmers) didn’t build this system. And in fact, it’s the system that really is not profitable for the majority of farmers. Most farmers are in the red year after year, and it’s very difficult to break free from it. So I think we also need policies in place to … give farmers both the financial resources and the education that they need to be able to shift to more diversified systems and to find markets for their products.”
Audience members also raised concerns about pesticide drift, concentrated animal feeding operations and rural access to cancer care.
The panel comes as state legislatures and courts across the country continue debating pesticide regulations, company liability protections and the environmental impacts of industrial agriculture.
The post ‘In every room, every hand would go up’: Panelists discuss cancer, pesticides and environmental risks appeared first on Investigate Midwest.
Fertilizer costs are squeezing farmers nationwide

Farmers across the United States are entering the planting season under mounting financial pressure, with fertilizer costs emerging as one of the most significant constraints on production, according to an April survey conducted by the American Farm Bureau Federation.
The survey, which collected responses from more than 5,700 farmers, found that about 70% are unable to afford all the fertilizer they need this year. The strain cuts across regions and crops, underscoring how rising input costs are affecting farm operations nationwide.
Shipping through the Strait of Hormuz — which connects the Persian Gulf to the Gulf of Oman and, through it, the Arabian Sea and global shipping routes — has been sharply disrupted since late February, when the United States and Israel launched strikes on Iran. The United States has also imposed a blockade on Iranian ports.
About a quarter of the global seaborne oil trade and one-third of fertilizer shipments pass through the strait, according to a March 2026 report by the United Nations Trade and Development, making it a critical chokepoint for agricultural inputs.
The impact varies by region. Farmers in the South report the greatest difficulty, with 78% unable to afford all required fertilizer, while Midwestern farmers are somewhat less affected, though nearly half still report affordability challenges.
Differences in purchasing strategies help explain part of the gap. About 67% of Midwestern farmers said they secured fertilizer earlier in the season, compared with just 19% in the South, highlighting differences in “planting decision timelines and exposure to recent price increases,” according to the Farm Bureau.
Since 2020, fertilizer has accounted for 33% to 44% of corn operating costs and 34% to 45% of wheat operating costs, according to USDA Economic Research Service Commodity Costs and Returns data.

Data Harvest (formerly Graphic of the Week) is Investigate Midwest’s way of making complex agricultural data easy to understand. Through engaging graphics, charts, and maps, we break down key trends to help readers quickly grasp the forces shaping farming, food systems, and rural communities. Want us to explore other data trends? Let us know here.
The post Fertilizer costs are squeezing farmers nationwide appeared first on Investigate Midwest.
YMCA expansion aims to meet daily needs of local kids, families
Watchdog group alleges Agriculture Secretary Brooke Rollins violated ethics rules

Agriculture Secretary Brooke Rollins has maintained “close ties” — including substantial bonuses before her confirmation — with her former employers in an alleged violation of federal laws and her ethics agreement with the U.S. Department of Agriculture, according to a report released Thursday from a nonprofit watchdog group.
The Campaign Legal Center, a Washington, D.C.-based group focused on campaign finance reform, filed its complaint with the USDA’s Office of Inspector General. Last year, President Trump fired the office’s longtime head and installed a senior advisor to Brooke Rollins.
The center said public officials are expected to act impartially.
“The public has a right to know that government officials are using their positions in service of the public’s best interest and not favoring the interests of their former employers or clients,” the legal center wrote in its complaint.
The USDA defended Rollins in an unsigned statement to Investigate Midwest on Friday.
“Secretary Rollins has fully complied with all applicable ethics requirements, per the Department’s Office of Ethics, and received the necessary approvals,” the department said. “The allegations made by CLC are a completely frivolous fishing expedition.”
Official appearances at former employers’ events
When she became agriculture secretary, Rollins agreed to, for one year, not “participate personally and substantially” with organizations she used to run, including the America First Policy Institute and the Texas Public Policy Foundation. Rollins helped create the America First Policy Institute to push Trump’s agenda after he lost the 2020 election to Joe Biden.
The one-year gap is governed by a federal regulation meant to prevent the appearance of favoritism for a public official’s previous employers and clients. Government ethics guidelines state that officials, while acting in an official capacity, should not use former employers’ events as a “preferred forum for repeated speeches.”
However, according to the Campaign Legal Center, Rollins made at least four appearances at events hosted by those organizations during her first year in office.
In February 2025, about a week after her confirmation, she was the keynote speaker at the Texas Public Policy Foundation’s annual summit. She spoke at length about U.S. agriculture.
In a video available on YouTube and referenced in the center’s complaint, she referenced Justice Clarence Thomas swearing her in and said, “When I left seven years ago and walked away from (the foundation) — well, I mean, not really; I never really go away, do I? But officially walked away to join the last White House. …”
In May 2025, Rollins appeared at the America First Policy Institute’s annual summit. The institute’s X social media account tagged her official government account to promote the speech.
In October 2025, Rollins appeared at an institute event focused on global energy. She was introduced as the agriculture secretary and asked for her “unique perspective at USDA,” according to the center’s complaint. The video is available on the institute’s website.
In her response, she seemed to include herself and Energy Secretary Chris Wright as part of the institute: “This is the importance of … organizations like America First and Texas Public Policy and others, that we really are at the front lines of not just playing offense, and we” — gesturing at Wright — “are able to play offense now.”
Rollins’ husband is an executive at an oil and gas company, according to her financial disclosure form.
In November 2025, Rollins appeared in her official capacity at a three-day institute gala. Along with other Trump officials, the institute’s website referred to her as a member of “AFPI’s cabinet.”
According to the ethics agreement Rollins signed, she agreed to resign from her position at the Texas foundation and the institute.
Neither the foundation nor the institute responded immediately to a request for comment Friday.
A large bonus before Rollins’ confirmation
Rollins’ nomination for agriculture secretary was publicly reported in November 2024. Around that same time, Rollins received substantial bonuses from the America First Policy Institute, according to financial disclosures and tax forms cited in the complaint.
In 2024, the institute paid Rollins a $300,000 bonus, according to the institute’s tax forms. Her bonuses in 2023 and 2022 were $50,000.
Other institute employees received six-figure bonuses in 2024, but Rollins’ was by far the largest, according to the institute’s tax forms. With the bonus, her total compensation for 2024 was more than $800,000.
However, in her financial disclosure form, she reported more than $1 million in “salary and bonus” from the institute. She signed the form Jan. 8, 2025, about a month before her confirmation.
“The timing of both of these substantial payments suggests that Rollins was awarded additional income after AFPI became aware of Rollins’ consideration for her government position,” the complaint alleges. Payments such as these raise “a legitimate concern that the employee may not act impartially.”
Federal guidelines dictate officials who receive such payments must recuse themselves from matters involving their former employer for at least two years.
Trump fired the longtime USDA inspector general last year
One of Trump’s first acts in office was to fire more than a dozen inspectors general, the independent government watchdogs tasked with rooting out waste and fraud.
The USDA’s inspector general, Phyllis Fong, was nominated for the position by President George W. Bush and had been in the position since 2002. After she defied Trump’s order by showing up to work, security agents escorted her out of her office, according to Reuters.
A federal judge found it was “obvious” Trump violated the law. Presidents need to provide Congress with “substantive rationale, including detailed and case-specific reasons,” before removing inspectors general.
However, the judge did not reinstate them because they could not show they were irreparably harmed. “If the IGs were reinstated, the President could lawfully remove them after 30 days by providing the required notice and rationale to Congress,” the judge, a Biden appointee, ruled.
The new inspector general for the USDA is John Walk. In the first Trump administration, he served as a White House counsel. Rollins served in the White House at the same time, as a policy advisor. Between July 2025 and his confirmation in January, Walk was a senior advisor to Rollins, according to his USDA biography.
At his nomination hearing, Sen. Amy Klobuchar asked Walk, given he has only held political roles under Trump while working for the government, how he would “maintain the necessary objectivity required to conduct meaningful oversight” in his new role. Walk replied, “I will follow all laws and regulations regarding conflicts of interest and impairments of judgments.”
At the same hearing, Sen. Adam Schiff, a California Democrat, asked Walk if he had the “strength of character” to blow the whistle if unethical behavior was happening at USDA. Walk said he would “follow the statute” and “fulfill my obligations to Congress.”
Delaney Marsco, the Campaign Legal Center’s director for ethics, said in a statement the organization is hoping for a full-fledged investigation.
“We have a strong hope that a result of our complaint will be accountability and appropriate treatment of the recusals moving forward, whether that accountability comes from public awareness or a formal investigation,” she said.
The inspector general’s office did not immediately return a request for comment Friday.
The post Watchdog group alleges Agriculture Secretary Brooke Rollins violated ethics rules appeared first on Investigate Midwest.
Carl Sandburg College part of $799.6M regional economic impact, study finds
Living With the Freedom Caucus
Wyoming is a land of admirable firsts. It is proud to be known as “the Equality State” as both the first territory (1869) and the first state (1890) to offer women the right to vote. It has the first national monument, Devils Tower, established in 1906. Yellowstone, the world’s first national park in 1872, is almost entirely in Wyoming.
In 1924, Democrat Nellie Tayloe Ross handily won a special election after her husband, the sitting governor, died in office. Wyoming thus became the first state to elect a woman governor, but it hasn’t elected one since. Nor has it elected a Democrat to any statewide office since Gov. Dave Freudenthal’s second term, which ended in 2008.
Wyoming Democrats are scarce on the ground; of the state’s 279,487 voters, only 28,311 are registered Democrats (just under 10%). Wyoming cast 71.6% (192, 633) of its votes for Trump in 2024. Today, only six of the 62 members of the Wyoming House are Democrats; two of the 31 state senators are Democratic.
Wyoming attained another first in November 2024, when the Wyoming Freedom Caucus became the first state-affiliate of the House Freedom Caucus to gain control of a state. Thirty-six of Wyoming’s House Republicans are now linked to the Wyoming Freedom Caucus, according to a report by Better Wyoming Action + Research, a nonpartisan, grassroots group formed by Wyoming journalists Nate Martin and Kerry Drake.
2024 was hardly the first time that out-of-state, would-be politicians, or their backers, identified Wyoming as a place to launch careers. As the saying goes, Wyoming is a small town with long streets; with under 600,000 people, it is the least populous state. This makes campaigning both relatively cheap and comparatively easy. It is also easy to acquire and use dark money in Wyoming. (Dark money refers to political spending where the donor is not disclosed and the source of the money is unknown.) Wyoming is one of only four states that allow businesses to be incorporated without disclosing the names of members or managers. That means that shell corporations, including Limited Liability Companies, can funnel candidates money without disclosing any actual donor names. In fact, Wyoming is the birthplace of the LLC; in 1977, it became the first state to allow their creation.
Since the Freedom Caucus’s founding in 2015 in the U.S. House of Representatives as an outgrowth of the Tea Party movement, the Freedom Caucus has been a growing, insurgent force within the Republican party, backing Trump’s efforts to overturn the 2020 election results and, in 2023, helping oust former House Speaker Kevin McCarthy. The movement, which now counts 31 House representatives among its members, has focused on stripping away government spending and social welfare programs, asserting independence from the federal government, and waging broad assaults on the rights of immigrants, transgender people and voting access.
Freedom Caucuses have since appeared in state houses from Arizona to Pennsylvania, in conjunction with the State Freedom Caucus Network, established in 2021 by Mark Meadows, former North Carolina congressman and White House chief of staff in the first Trump administration. The network is said to provide a full-time paid staffer to each state Freedom Caucus chapter and even tell legislators how to vote. Members of the Wyoming Freedom Caucus, for instance, reportedly receive such text messages daily on the topic.
Wyoming is one of 15 state legislatures that now have an official chapter of the State Freedom Caucus Network. Most are formed in Republican-dominated states like Idaho, Missouri and Louisiana, but many have been growing in states with Democratic strongholds or a Democratic governor, such as Pennsylvania, Maryland and Minnesota.
State Freedom Caucuses have championed causes like school vouchers, which divert state funds for public schools to support private and religious schools, to removing books from public libraries. A 2024 study by Matthew Green, a politics professor at the Catholic University of America, found that the top-down model of the State Freedom Caucus Network has contributed to state-level polarization and intraparty conflict, as the caucus often appeals to lawmakers who lack internal party influence and are electorally vulnerable.
The Wyoming Freedom Caucus first emerged in 2018, indicating it would be Wyoming-directed. But, by 2020, it had eight legislators aligned with the national Freedom Caucus who, according to Better Wyoming, began working as “a secretive group of legislators that votes according to orders they receive from their leaders in Washington, D.C.”
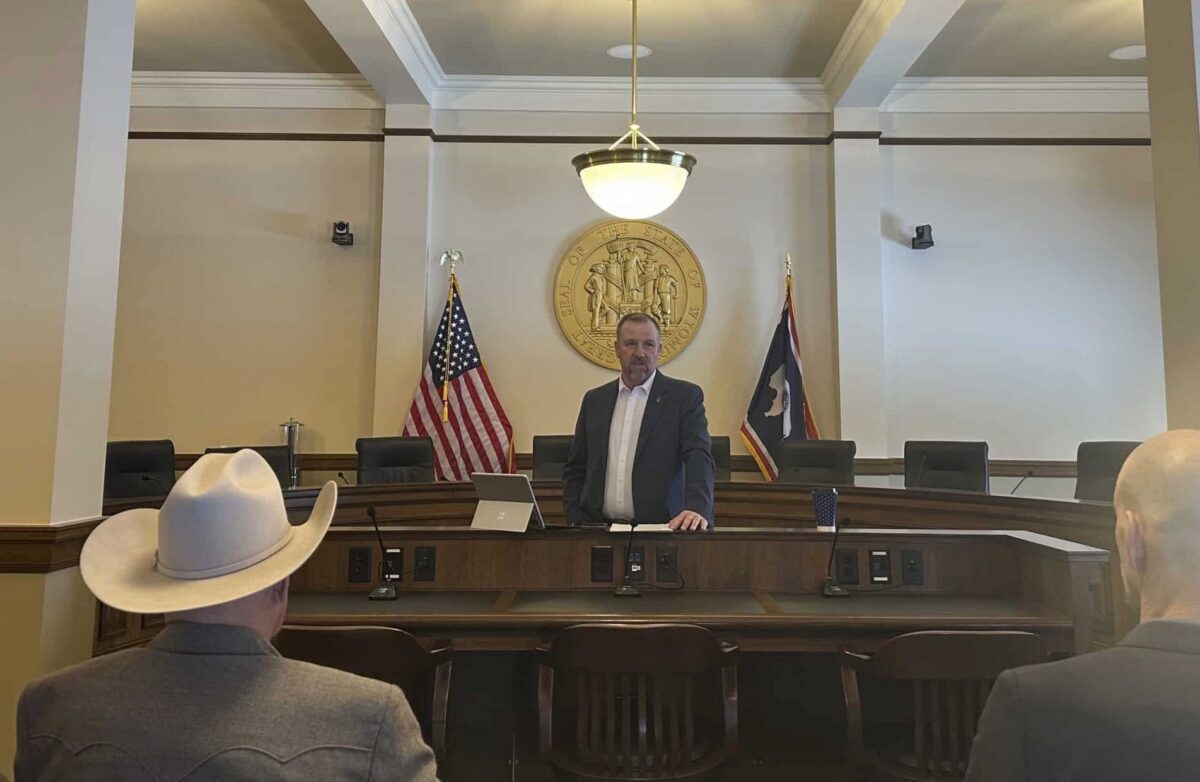
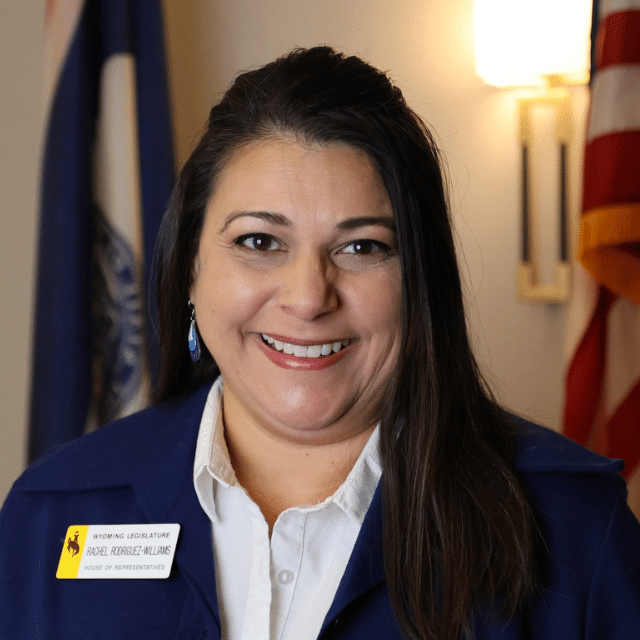
On its website, the Wyoming Freedom Caucus says it is comprised of Wyoming House Representatives who share an ideology of “limited government, individual liberty, and American prosperity.” Under the leadership of chair State Rep. Rachel Rodriguez-Williams, who represents District 50 in northwest Wyoming, they “plan together, work together, and pray together in pursuit of policies that promote truth by protecting life, private property rights, and Judeo-Christian family values.”
Immediately after it gained control of the Wyoming House, in 2025, the Freedom Caucus executed its “Five and Dime Plan,” passing five bills within the first 10 days of the general session. These included repealing gun-free zones (including around schools), a series of onerous “election reform” measures, a DEI ban in higher education, ending state investment in environmental, social and governance funds and property tax reform. For good measure, it ushered in a wave of anti-trans bills. It didn’t get everything it wanted in 2025, but it came close.
Despite such success, not all members who support or align with the Freedom Caucus agenda are willing to say they do, even though their votes are clear. For example, Rep. Daniel Singh, from Cheyenne House District 61, maintains he has “left” the Wyoming Freedom Caucus. However, he supported all 28 of its 2025 priority bills and voted with its chair 84% of the time on bills tracked by Better Wyoming that year. In January, Singh and several other Cheyenne Representatives were invited to a forum hosted by the Cheyenne chapter of Braver Angels, a citizens group working to unite the country’s political divide. When questioned about his legislative decision-making practices, he tried to dispel rumors of outside pressure via “mass text messages” (from Freedom Caucus operatives) on how to vote.

One attendee, Martin L. Hardscog, Sr., was so frustrated by his encounter there with Freedom Caucus member Rep. Ann Lucas, House District 43, that he wrote the Wyoming Tribune Eagle, Cheyenne’s local paper, about it. He attempted to talk to Lucas about property tax reductions, trying in vain to point out that other letter writers and columnists were opposed to cuts championed by the Freedom Caucus. Hardscog wrote that he came away from their exchange “feeling undone/outgunned/dismissed.”
Marguerite Herman, another attendee, has lobbied on behalf of the Wyoming League of Women Voters for 20 years. Established in the 1950s, the nonpartisan League has members statewide and active chapters in five of Wyoming’s 23 counties. Interviewed separately, she tells Barn Raiser, “Freedom Caucus members (including her own, House District 11 Rep. Jacob Wasserburger, who “declined” caucus membership but routinely votes with it) show little interest in trying to understand a different point of view or learning much about the issues.” She says they display “group think” and seem to believe their “constituents are more ideological than geographical.”

Lobbyist and former Rep. Sara Burlingame’s experience with the Freedom Caucus is similar. (Burlingame served a Cheyenne constituency from 2018-2020 and is now the executive director of Wyoming Equality, an LBGTQ+ advocacy group and is no stranger to working across party lines.)
Burlingame and Herman say Freedom Caucus members appear to vote according to regular (outside) communiqués. Burlingame calls working against bills promoted by the Freedom Caucus “brutal” and says there’s “no pretense that they care about trying to understand (an) issue or coming to any kind of consensus.”
She and Herman note that Freedom Caucus committee chairs have not enforced traditional rules of hearing decorum. Burlingame says some even allow witnesses testifying against Freedom Caucus-favored bills to be “treated with contempt.” In times not so long past, Burlingame says, the Republican supermajority would at least engage in productive conversation with people holding opposing views. Current “alt-right” members of the legislature, she says, no longer wish to even be seen with Democrats.
In January, the Wyoming Freedom Caucus announced its top priorities for the February/March budget session, only 20 days long. These included:
- Returning state spending to pre-pandemic levels
- Requiring all Wyoming counties to use pen and paper ballots
- Expanding “parental rights,” giving parents a path to pursue civil litigation against state agencies or school districts
- Banning “obscene pornographic materials” from children’s sections in public libraries (a label applied to books containing LGBTQ representation)
- Codifying public access to judicial opinions and court documents
- Overhauling the judicial nominating process in light of a January Wyoming Supreme Court decision protecting abortion access
None became law; two failed to be introduced in the Freedom Caucus-dominated House and two got no traction in the Senate. Only one of its six lower-tier goals, concerning protection of pregnancy resource centers, was signed into law in 2026. So much for their top priorities.
Why these defeats? At its press conference on the last day of the session, Freedom Caucus Chair Rodriguez-Williams said:
Many of our priorities did fail. Some in the House, due to the two-thirds threshold for a budget session that’s required, and many in the Senate, due to the upper chamber calling it quits. Regardless of where our priorities failed, it’s clear that we need reinforcements here in Cheyenne, in the state capital, in both chambers.
More experienced Republicans had a different take on why the Freedom Caucus didn’t fare as well as it expected. Its bare-bones budget proposal would have gutted the Wyoming Business Council, and cut other governmental programs and services long embraced by Wyoming people, including public media.
Interviewed by Wyoming Public Radio a few days after the 2027-2028 budget passed March 2, Sen. Ogden Driskill, (R-Devil’s Tower) said, “[The Freedom Caucus] went out of their way to cut the budget, and they showed what would happen if they truly got control.” He continued, “They cut to the point that it was absolutely unacceptable to almost everyone in the state. They overran their skis pretty hard on that.”
Also, a remarkable thing quickly dubbed “Checkgate” occurred as the session began, which did not reflect glory upon the Wyoming Freedom Caucus, much less augment popular support for it. On February 9, a self-styled “conservative activist” with caucus connections appeared on the House Floor after adjournment for the day to hand out $1,500 checks to some Freedom Caucus members. (Reportedly 10 Freedom Caucus-aligned lawmakers received checks, though not all on the House floor).
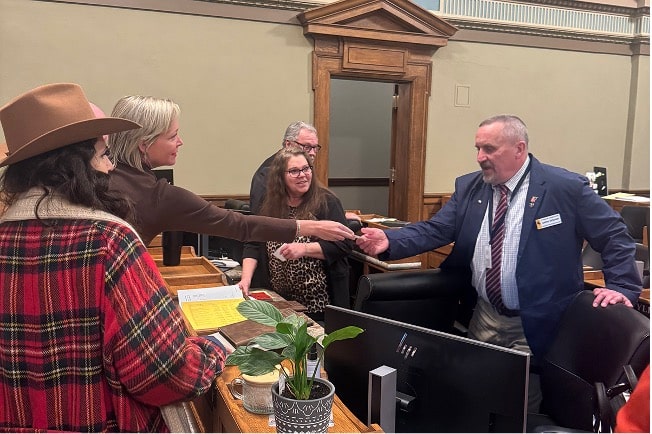
One check delivery was photographed by a Democratic lawmaker and soon shared with the press. Controversy, blame, an executive order and internal investigation quickly ensued. The matter made statewide news for months. As things stand now, an external criminal investigation is pending and there’s talk of ethics training for legislators and better signage on chamber floors.
Tellingly, the Wyoming Legislative Service Office has been tasked with seeing how neighboring states handle seamy incidents and reporting back to legislative management. Who knows? Perhaps “Checkgate” will prove to be yet another first for Wyoming, embarrassingly enough.
Legislative management recently announced a list of 90 topics it will address over the summer wyoleg.gov, but August 18 is likely to really reveal where the Wyoming legislature is headed next. In Wyoming, it is almost a foregone conclusion that whoever wins any Republican primary will go on to win in the general election. Better Wyoming and many others will be working hard to get out the vote and make sure potential voters know how to navigate unfamiliar restrictive rules. They will be hoping mightily that voters will know as much as possible about candidates, and particularly their voting records, regardless of whether candidates acknowledge their affiliations with the Freedom Caucus. After the exploits of the 2026 session, few Wyoming voters can be said to have no opinion on the Wyoming Freedom Caucus. In due course, the vote will show what that collective opinion is.
The post Living With the Freedom Caucus appeared first on Barn Raiser.
With Iran War, food prices will grow faster than originally expected this year, USDA predicts

In late February, President Trump approved attacks on Iran — and potentially blew a hole through a signature campaign promise.
As he ran for a second presidency, Trump said repeatedly he would “defeat inflation.” Once in office, and as grocery prices continued to increase throughout 2025, he said affordability was a “con job.”
Food prices were already expected to increase in 2026, and at a faster rate than their 20-year historical average.
But the war with Iran will likely turbocharge grocery prices, particularly beef, according to revised forecasts from the U.S. Department of Agriculture.
In a report published on Feb. 25, the USDA predicted overall food prices would increase by 3.1%, faster than inflation.
Beef prices were expected to increase 5.5%.
However, since then, the war has driven up fuel prices, which will increase the price of food and other products.
In a report released on March 25, the USDA revised its predictions. Overall, food is now expected to grow by 3.6%. If that holds true, food prices will increase more than in 2020, when the COVID-19 pandemic snarled supply chains, according to the USDA.
Beef prices are now expected to increase by 10.1%.
Egg prices, a major part of Trump’s messaging on affordability early in his second term, are still expected to drop but not as much as predicted.
The post With Iran War, food prices will grow faster than originally expected this year, USDA predicts appeared first on Investigate Midwest.